When you are a crypto trader, the information on the screen is your ally. It allows you to interpret what is going on with cryptocurrency prices 24/7. Then, you can buy and sell at the best prices at the right time, in terms of fluctuations in the economy. Prices are volatile and so a close eye needs to be kept on them.
We shall consider here methods and tools such as the tradingview indicator, that will make it easier to trade cryptocurrency because you have at your fingertips, and in your eye line, what is going on in terms of price movements.
TradingView Indicator
Indicators are defined as calculations displayed on charts, which are based on prices or volume.
Specifically, TradingView indicators will add extra data to charts, to allow traders to assess the markets for cryptocurrencies, for example. Overlaying will be used to display data on top of existing charts.
Customized indicators can be created for Bitcoins, for instance. Various labels and alerts can be added to help with following cryptocurrencies and making trading decisions.
It is useful to be able to see various averages displayed. These might include moving averages and weighted averages.
To have extra information displayed for our specific needs will make the information more valuable to us, in terms of what it tells us and how much easier it is to interpret when put into context.
TradingView is the most popular chart and tool for technical analysis that traders of all kinds of markets will use. Next to it is Coinigy, which is also well known in the crypto world.
Multiple Screens
The multiple screens that traders use will allow them to view lots of information at the same time, which is beneficial because prices change in an instant and one price can impact another. It is about having the whole picture in front of you to decide. The state of the economy and company news about fortunes will greatly affect prices.
Apart from using ultrawide monitors as an option, most monitors will be capable of accommodating a maximum of four charts. To track twelve charts at once, you could expect to have at least three monitors. For sixteen charts, you would need four monitors.
Best Type of Graphs for Cryptocurrency
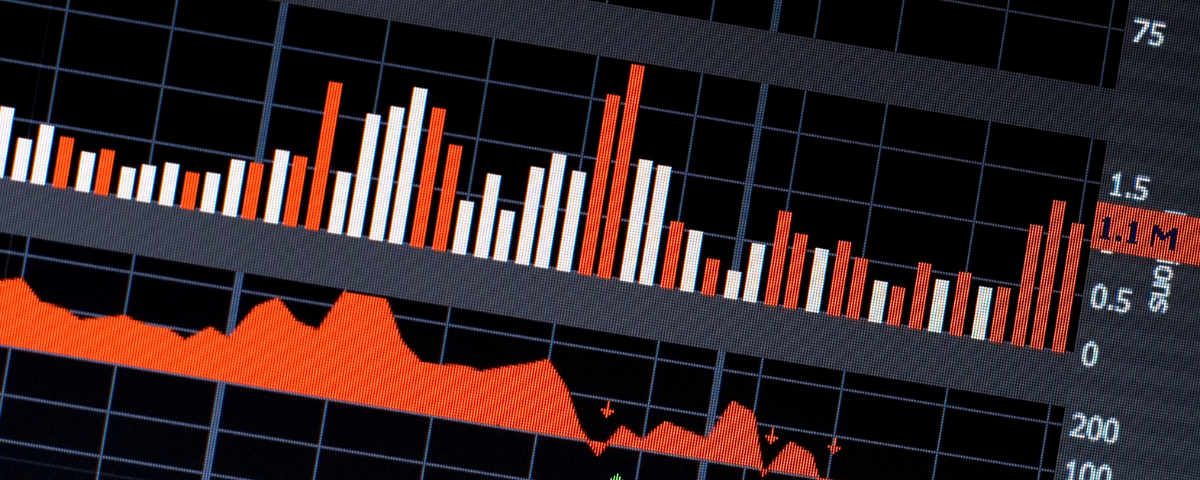
The most popular of the crypto charts is the Japanese candlestick chart. Each candle on this type of chart will show the price movements of an asset during specific time intervals.
A tick chart is considered the best type of chart for day traders. It will show detailed information and provide trade signals when a market is active.
A good chart is required for the effective monitoring of any market price.
How to Read Crypto Trend Lines
Crypto trend lines will be drawn along the extreme points. Where prices are moving consistently higher, then trends lines will slant upwards. Where there is a downward trend in a market, a line will slant downwards. These trend lines are used in determining resistance and support levels.
The ability to read these trends lines is made easier by how they are displayed and are important in ensuring you are making the right decisions. We need to know just what is happening with a price over time. That time can be on the same day, or over a longer period. The very nature of trends is that they are measured over greater periods.
It is important to have effective onscreen information, whether you are a crypto trader or deal in shares or foreign exchange. The more information that can be displayed on one chart, the fewer screens that will be required to view the information. It is a matter of clarity but then, we do want to view information together where possible, when it is related, and one piece of data will impact another.